sagefr0g
Well-Known Member
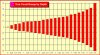
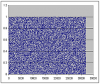
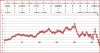
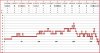
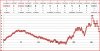
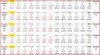
i made a excel spreadsheet, where the idea was you could shuffle a pack and then graph the true count at various points of depth into the pack.
haven't really the foggiest if i did it right or if the random number generator for excel is bogus as far as shuffling.
so but anyway the way the sheet is set up you can just repeatedly hit ctrl-y and you'll keep generating these TCvsDepth graphs.
so dong this and watching how the graphs mapped out for each shuffle it struck me how so high a percentage of shuffles the true counts were the majority of the time really low at the 1st deck dealt point, rarely going above TC=1 sort of thing.
well anyway i guess like for a six deck pack and if you use full deck integers for determining your TC then at the 1st deck dealt point the highest true count you could get would be 8 if your flooring. so but for a whole bunch of trials so far i've just seen a TC = 4 as the highest.
just it made this question come to mind. does anyone know if their are expected true count frequencies by deck depth for a given pack, for example say a six deck pack?
Attachments
-
 96.4 KB Views: 673

") . I use Wavemetrics's Igor Pro which is the DEFINITIVE numerical and statistical analysis tool.
. I use Wavemetrics's Igor Pro which is the DEFINITIVE numerical and statistical analysis tool.