math time
I took the following data from Schlesinger's Blackjack Attack, 1st edition.
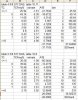
game 4.0/6 S17 DAS, table 10.11
TC TCFreq% winrate A*B
<=-1 25.94 -1.61 -41.7634
0 49.14 -0.38 -18.6732
1 11.66 0.37 4.3142
2 6.63 0.9 5.967
3 3.03 1.36 4.1208
4 2.04 1.96 3.9984
5 0.8 2.61 2.088
6 0.43 3.17 1.3631
7 0.17 3.94 0.6698
>=8 0.16 4.98 0.7968
-37.1185 sum A*B
game 5.5/6 S17 DAS, table 10.8
TC TCFreq% winrate A*B
<=-1 30.58 -1.98 -60.5484
0 39.64 -0.34 -13.4776
1 10.46 0.43 4.4978
2 6.98 1.03 7.1894
3 3.29 1.46 4.8034
4 3.32 2.13 7.0716
5 1.65 2.79 4.6035
6 1.35 3.5 4.725
7 0.53 3.91 2.0723
>=8 2.19 5.92 12.9648
-26.0982 sum A*B
Several questions/comments:
1. Where does the 'Don get this data from? Is it from simulations?
2. I asked ques 1 because if you add up the TC frequency % of all counts >=1, for the first chart, you get 24.92, which is greater than 25.94 for all counts <=-1. What?! The shoe will have counts <=1 more often by 1.02% of the time? I'm assuming this is an error as a result of the way that the true count frequencies was derived, whatever way that was. The TC frequency below counts of 0 and above the counts of 0 should be symmetric and equal, right?
3. In column 3, which I've labeled A*B, I multiplied TCFreq% and winrate. Then I summed up A*B. The results of the first table suggests that you have a -0.371185% edge if you were to flat bet in a 4/6 deck S17 DAS game. The results of the second table suggests that you have a -0.260982 edge if you were to flat bet in a 5.5/6 deck S17 DAS. Am I interpretting this right? Because these numbers aren't equal to the -0.44% edge calculated by the basic strategy engine (on this website in the left hand column).
4. I'm using hi-lo as the count system, which I think the above tables also work for.
5. The charts show how there are higher counts with deeper pen. Just an interesting factoid.
Next, let's calculate standard deviation, using a spread I came up with.
table 4.0/6 S17 DAS, table 10.11
TC TCFreq% winrate A*B bet
<=-1 25.94 -1.61 -41.7634 1 25.94
0 49.14 -0.38 -18.6732 1 49.14
1 11.66 0.37 4.3142 2 46.64
2 6.63 0.9 5.967 4 106.08
3 3.03 1.36 4.1208 6 109.08
4 2.04 1.96 3.9984 8 130.56
5 0.8 2.61 2.088 10 80
6 0.43 3.17 1.3631 10 43
7 0.17 3.94 0.6698 10 17
>=8 0.16 4.98 0.7968 10 16
-37.1185 27.46565856
-37.1185 SD/hand
table 5.5/6 S17 DAS, table 10.8
TC TCFreq% winrate A*B
<=-1 30.58 -1.98 -60.5484 1 30.58
0 39.64 -0.34 -13.4776 1 39.64
1 10.46 0.43 4.4978 2 41.84
2 6.98 1.03 7.1894 4 111.68
3 3.29 1.46 4.8034 6 118.44
4 3.32 2.13 7.0716 8 212.48
5 1.65 2.79 4.6035 10 165
6 1.35 3.5 4.725 10 135
7 0.53 3.91 2.0723 10 53
>=8 2.19 5.92 12.9648 10 219
-26.0982 36.922332
-26.0982 SD/hand
To calculate this, I used the method from:
http://www.blackjackforumonline.com/content/6DeckText.htm
How to Use Frequency Distributions to Determine Your Card Counting Win Rate and Fluctuations
See the section: "Standard Deviation in Card Counting"
So with the bet spread from 1-10, the last column is the TCfreq% multiplied by the bet^2. Then the bottom of the last column is the 1.1 * SQRT (sum of the column). This should represent the SD per hand in units, for this particular bet spread and applied to the true count frequencies of this type of game.
It's been awhile since I've tried to do a lot of math.
If I did this right, I think I then know how to calculate the ROR, etc. But can you please check the above math?