sagefr0g
Well-Known Member
Canceler you there? lol ......... help, lol......
errhh ok, i got some data.
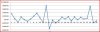
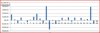
daily earnings
and i know what the expected value for daily earnings is
so is there a function in excel that i can use to estimate the standard deviation?
i was gonna use STDEV but there's no where in that function to enter the known expected value.
any help?:fish::fish:
edit: so maybe there shouldn't be anyway in there to enter ev, i guess, right? :whip:
like ok if i use STDEV, is that figure produced, one standard deviation?
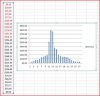
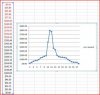
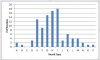
can i come up with one of those bell curve graph's with my data?
errhh ok, i got some data.
daily earnings
and i know what the expected value for daily earnings is
so is there a function in excel that i can use to estimate the standard deviation?
i was gonna use STDEV but there's no where in that function to enter the known expected value.
any help?:fish::fish:
edit: so maybe there shouldn't be anyway in there to enter ev, i guess, right?
:whip:like ok if i use STDEV, is that figure produced, one standard deviation?
can i come up with one of those bell curve graph's with my data?