More Math Questions

eps6724

Well-Known Member
#1
I am looking for something-preferrably SIMPLE-that I can get my hands on that explains how variances and such are figured. I am NOT a math person, so I guess I am looking for something that starts with baby-steps that I can work through. BS I understand, but as to figuring the rest....

Thanks!

eps6724
 

sagefr0g

Well-Known Member
#2
same question here....

wow i'm in the same boat. from the many years past that i walked the halls of academia i never had a course in probability or statistics. closest i ever came was a course in quantitative analysis for chemistry that did a lot of hand waving about standard deviation and standard error. then advanced physical chemistry that indtroduce me to the Shrodinger equation. other than that i've just had the maths of arithmatic, geometry, algebra, trigonometry, analytic geometry, calculus and differential equations.
i'd like to find a fairly non-rigorous treatment of probability and statistics that can give a layman a fundamental understanding of the concepts as they relate to blackjack.
 

Sonny

Well-Known Member
#3
Variance is actually a fairly simple concept. The statisticians just make it sound hard! :p

For any group of numbers there is a mean (often called the average). For example:

2,4,7,9,5,1,5,7

The average of the above numbers is 5, but most of the numbers are either higher or lower than 5. Knowing the average really doesn’t tell us much about this group. We also want to know how far away the numbers are from the mean. That is where variance helps us.

To calculate the variance of a group, just subtract the mean from the number and square the value. This will give you the variance for each individual entry. Then add up all of the individual variances and divide by the total number of entries. Essentially, you are calculating the “average squared difference” of the numbers from the mean. Here’s how it works for the example above:

(Number – Mean)^2 = var

2-5=-3^2=9
4-5=-1^2=1
7-5=2^2=4
9-5=4^2=16
5-5=0^2=0
1-5=-4^2=16
5-5=0^2=0
7-5=2^2=4
TOTAL = 50
AVERGAGE = 50 / 8 = 6.25
Var = 6.25
SD = 2.5

The variance doesn’t really help us much so we convert it to standard deviations by taking the square root: 2.5. This gives us a general idea of how far the results were from the mean. In this case they were all pretty close so the variance is low, but let’s take another example:

3,78,32,89,2,56,79,5

The mean is now 344 / 8 = 43. The variance is:

3-43=-40^2=1600
78-43=35^2=1225
32-43=-11^2=121
89-43=46^2=2116
2-43=-41^2=1681
56-43=13^2=169
79-43=36^2=1296
5-43=-38^2=1444
TOTAL = 9652
AVERGAGE = 9652 / 8 = 1206.5
Var = 1206.5
SD = 34.73

The variance is much higher because many of the entries were far from the mean. Knowing the variance showed us that there were large fluctuations in this group and that the mean was somewhat misleading. Instead of always expecting a result of 43 every time, we know that our actual results will vary greatly.

There are many different formulas for variance that are used for different types of data. The one above is the simplest and most intuitive. Hopefully it will help you to understand the concept of variance and SD.

-Sonny-

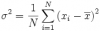
P.S. - Now wasn't that much easier than this:
 

Attachments

Last edited:

sagefr0g

Well-Known Member
#4
Sonny said:
........

To calculate the variance of a group, just subtract the mean from the number and square the value. This will give you the variance for each individual entry. Then add up all of the individual variances and divide by the total number of entries. Essentially, you are calculating the “average squared difference” of the numbers from the mean.
this is where i get lost. point being what is the reasoning or impetous behind calculating the average squared differance?

Sonny said:
The variance doesn’t really help us much so we convert it to standard deviations by taking the square root:
There are many different formulas for variance that are used for different types of data. The one above is the simplest and most intuitive.
again this is where i get lost. point being what is the reasoning or impetous behind calculating the square root?

Sonny said:
Hopefully it will help you to understand the concept of variance and SD.

-Sonny-
it does help and even more if the two questions above can be answered hopefully non-rigorously but rigorous would do.
 
#5
Let's see if i can bring some light here.

The sqrt of an square expresion is the absolute value of the expresion. sqrt((-2)^2) = 2

So we want the absolute value of how far are the numbers in the group from the mean. Say we have {1,5} the mean is 3, and the differences of the num in the group with the mean would be -2,2 if we add this two numbers we get zero, which is wrong given that not all numbers are '3'.

That's why we take ((-2)^2+(2)^2)=16 getting back to the absolute value definition we need to sqrt 16, so we get 4.

Now to get the std deviation we divide the absolute difference of each number with the mean, our 4 with the number of numbers in the group (2).

STD=2, this means that in average the numbers in our group differ in two units from the average (3).

Hope this helps a bit...

P.D Im not a native english speaker so...
 

eps6724

Well-Known Member
#6
uh.....

Well, not to be stupid, but...I DO have a college degree-in Music (Opera)Performance. The only math I had to worry about was when the conductor switched from straight 4/4 time to cut time. Hence, my inability to understand ANYTHING previous!

Maybe I should explain what I'm looking at...I have gone to the bjmath site, followed some really interesting things, was totally clueless, but it piqued my interest. For instance, on the cvcx viewer, I would like to know just what everything means from std dev to ev. Not necesarily how to figure them, but what they mean, what they mean to me, and how I can use them to my advantage. I guess what I am REALLY looking for is a beginner's (idiot) guide to AP Blackjack. ( My first read was Snyder's Blackbelt-learned a lot, but still feel there is a BUNCH I just didn't understand)!:confused:

Thanks in advance!!
 
#7
sagefr0g said:
it does help and even more if the two questions above can be answered hopefully non-rigorously but rigorous would do.
Sonny's explanation is good and after you absorb it all, you should conclude
to the following:
The mean is the odds of the game your playing.
Variance and s.d. is how much your results will deviate from the odds or expected result.
The square root of the number of hands you played, say 100 hands is 10.
Add 10% for doubles and splits, which brings it to 11. Then multiply by the odds of the game (a counter 1 to 1 and 1/2%) a basic strategy player (a minus .05%). This give you your expected result. Your session or sessions will give you your actual results. The difference between the theoretical and the actual is variance or s.d..

Played 100 hands and the result was 15 units
The theoretical result should be 11 units.
Your ahead of expectation by 4 units.

Schlesinger in Blackjack Attack/ second edition, gives a formula for a quick calculation of s.d. and variance on page 18.
 

sagefr0g

Well-Known Member
#8
i think i'm begining to get it.
ev is the value you expect most often to experience in the events of the long run... it is also the mean.
variance is the value of actual events that happen in the long run.
standard deviation is a measure of how often in the long run you can expect events to vary from the expected value. one standard deviation would show you how results shall vary 68% of the time. two standard deviations would show you how results shall vary 95% of the time. three standard deviations would show you how results shall vary 97% of the time.
....... or am i still not getting it ? :confused:
 
#9
Coffee or no coffee.

sagefr0g said:
i think i'm begining to get it.
ev is the value you expect most often to experience in the events of the long run... it is also the mean.
variance is the value of actual events that happen in the long run.
standard deviation is a measure of how often in the long run you can expect events to vary from the expected value. one standard deviation would show you how results shall vary 68% of the time. two standard deviations would show you how results shall vary 95% of the time. three standard deviations would show you how results shall vary 97% of the time.
....... or am i still not getting it ? :confused:
If you flipped a coin ten times and the result was ten heads and you stopped for a coffee break to analyze it, you have witnessed variance. After coffee you again filpped the coin and this time you get ten tails, again you have witnessed variance if you analyzed it. If you hadn't taken a coffee break and analyzed the session, nothing really happened. Your right at expectation.
Variance is a temporary situation that may be short or long. It has no set point, it's all over the place. SD is just a attempt to put it into three neat little packages. Hence you'll experience one s.d. 68% of the time and two s.d's 95% of the time and the extreme the rest of the time.
 

Sonny

Well-Known Member
#10
no coffee

jomoats said:
Played 100 hands and the result was 15 units
The theoretical result should be 11 units.
Your ahead of expectation by 4 units.
I’d love to see a card counter who is making 11 units per hour! :laugh:

Although everything you said is correct, your math seems to be pretty far off. You don’t need to use any square root functions to find the EV since EV is additive. You only need to use squares when using SD in order to convert it back into variance. SDs are not additive but variance is so most calculations will convert SD into variance in order to manipulate it.

I think you may have confused the EV formula for the SD approximation formula, which, by the way, Schlesinger acknowledges is a gross underestimate of the actual SD in most cases. I don't have the page number handy but he mentions this in the same chapter you cited.

Hopefully your magic progression system is not based on these numbers.

-Sonny-
 

sagefr0g

Well-Known Member
#11
more on standard deviation

just scan read a section in Snyder's Blackbelt in Blackjack concerning standard deviation. in it he explains how in a nearly dead even blackjack game one would normally not be behind or ahead more than 20 units after about 100 hands or about one hour of play. but that on rare occasions one might find ones self 35-40 units ahead or behind for an hour of play. these estimates are based on the premise that the player only bets one unit per hand.
so i suppose Snyder's synopsis gives a benchmark of what one standard deviation and two standard deviations are for the idealized dead even blackjack game.
with this in mind i find the following snippet copied from Wikpedia interesting:
"When deciding whether measurements agree with a theoretical prediction, the standard deviation of those measurements is of crucial importance: if the mean of the measurements is too far away from the prediction (with the distance measured in standard deviations), then we consider the measurements as contradicting the prediction. This makes sense since they fall outside the range of values that could reasonably be expected to occur if the prediction were correct and the standard deviation appropriately quantified."
the point being the standard deviation as described by Snyder can give us an idea of how closely we can know or be cognizant of the behaviour of the idealized dead even game of blackjack.
 
Last edited:

Canceler

Well-Known Member
#12
On to more practical matters...

I don't know what this code wrap thingy is supposed to be used for, but it keeps my columns in line. Cool! Anyway...

These are drastically edited results of a sim of KO using PowerSim. (So true count is actually running count, in this case.)
Code:
True Count:    Frequency:       Win Rate:       Variance:
 -10:            6978180        -.0087362        1.32504
  0:             4467912         .0115487        1.273438
  10:            586589          .0408344        1.199234
The first three columns are important, useful information. The Variance column is what I don't understand. I can see that the variance reduces as the count gets higher, but so what? What use am I to make of this information?
 

sagefr0g

Well-Known Member
#13
Canceler said:
I don't know what this code wrap thingy is supposed to be used for, but it keeps my columns in line. Cool! Anyway...

These are drastically edited results of a sim of KO using PowerSim. (So true count is actually running count, in this case.)
Code:
True Count:    Frequency:       Win Rate:       Variance:
 -10:            6978180        -.0087362        1.32504
  0:             4467912         .0115487        1.273438
  10:            586589          .0408344        1.199234
The first three columns are important, useful information. The Variance column is what I don't understand. I can see that the variance reduces as the count gets higher, but so what? What use am I to make of this information?
with respect to practicality i suppose one could ignore variance and just use a 'cookie cutter' betting scheme that works at given true counts.
the thing about variance and the standard deviation you can determine from it is that you begin to get a picture of the degree of risk you are facing. so then you have quantified values that you can use to determine risk of ruin and optimal bets according to Kelly Betting.
additionally from my perspective i like to know what the variance is likely to be as that gives me an understanding of just how wildly the game fluctuates hence i can adjust my frustration level. :joker:
 
#15
Sonny said:
I’d love to see a card counter who is making 11 units per hour! :laugh:

Although everything you said is correct, your math seems to be pretty far off. You don’t need to use any square root functions to find the EV since EV is additive. You only need to use squares when using SD in order to convert it back into variance. SDs are not additive but variance is so most calculations will convert SD into variance in order to manipulate it.

I think you may have confused the EV formula for the SD approximation formula, which, by the way, Schlesinger acknowledges is a gross underestimate of the actual SD in most cases. I don't have the page number handy but he mentions this in the same chapter you cited.

Hopefully your magic progression system is not based on these numbers.

-Sonny-
There was no attempt at math. I just used figures at random to demonstrate what format your records should show.

I use Schlesinger's formula to calculate my own s.d.
I also don't believe counters make more than one unit an hour.

There is nothing magic about my progression just as there is nothing magic about counting. Mine just happens to be better.
 

Cass

Well-Known Member
#16
jomoats said:
There was no attempt at math. I just used figures at random to demonstrate what format your records should show.

I use Schlesinger's formula to calculate my own s.d.
I also don't believe counters make more than one unit an hour.

There is nothing magic about my progression just as there is nothing magic about counting. Mine just happens to be better.
If you can't make at least one unit per hour you are playing the wrong game!
 

Sonny

Well-Known Member
#17
Canceler said:
Code:
True Count:    Frequency:       Win Rate:       Variance:
 -10:            6978180        -.0087362        1.32504
  0:             4467912         .0115487        1.273438
  10:            586589          .0408344        1.199234
...The Variance column is what I don't understand. I can see that the variance reduces as the count gets higher, but so what? What use am I to make of this information?
You could use the variance at each TC to calculate your optimal bet as follows:

Bet = Bankroll * Win Rate / Variance * Kelly Fraction

You will also want to know your overall variance in order to find your hourly SD and overall ROR. You can also use it for fun things like finding your probability of being ahead after X hours of play and the number of hands it will take to overcome the variance of the game (aka the long run).

-Sonny-
 
Last edited:
Top