Due to the overwhelming response (actually, there were only two…but I’m easily overwhelmed!

) I have decided to upload my spreadsheet. It’s really just an expanded version of Table 2.1 in Blackjack Attack. The results should be pretty accurate estimations, but once you find a good bet spread you should run a sim just to double-check the results. Here is brief description:
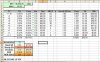
The
BR (dollars and units) and
Unit (dollars) are self explanatory. Just enter your current bankroll and unit size (both in dollars).
The
EV column is the advantage at each TC. The ones on the spreadsheet are pretty generic so you might want to enter your own custom ones from a simulator.
The
Freq column is the frequency of each TC. These are also from a generic simulation. Feel free to change them if you want.
The
Var column is the variance for one hand of BJ. It is usually around 1.33-1.36 so you probably won’t have to change it, but you can if you want.
The
Bet column is the amount you want to bet at each TC. This is where you will be experimenting with different bet sizes and spreads. You can enter a bet of zero at any TC you plan to Wong out of.
The
BU^2 column is the Betting Unit Squared formula. This is used for calculating your variance and SD.
The
h column is the number of hands you want to play. If you want to play 2 hands of $50 each, just enter $50 in the Bet column and 2 in the h column.
Next is the
Var+(h-1)*Cov column. This one looks really confusing but is actually quite boring. It is the Variance Per Round formula. You will see that it is equal to the Var column until you play multiple hands. As soon as you spread to two hands this column will calculate the covariance and add it to the original variance for that round of play. Playing multiple hands is much less risky than playing a single hand so you will notice that the variance increases slowly as you add more hands. This column is used to calculate your final SD statistics.
The
prod column is just the product of the individual variance, frequency, BU^2 and number of hands. This will sum to your total variance. This is even more boring than the last column.
The next
EV column is so boring I won’t even mention it.
Now we get to a very exciting column - The
OW formula. This calculates your Optimal Wager based on your bankroll, advantage and per-round variance. This will be the Full Kelly wager. I usually start around half-Kelly, then slowly build up the bets until I have a good compromise between EV, ROR and simplicity (ability to parlay bets without looking conspicuous). You will also notice that the OW will change if you spread to two hands. In this case the OW column will calculate the optimal wager for each hand (your total wager would be OW * h). This will allow you to get more money on the table with the same amount of risk.
The results of the spreadsheet will all appear at the bottom in pretty pastel colors. It will show you the
Hands Per Hour (it usually assumes 100 unless you are Wonging, in which case it tallies up the frequencies of your bets to calculate it), your
Per-Hand SD (units and dollars), your
Hourly SD (units, dollars) and your
Hourly EV (same deal).
The next two rows are additions that I made. I’ve included some information on your ROR. The first number is your standard lifetime
ROR. The one to the right of it is your lifetime ROR if you plan to cut back to half of your bets if you lose half of your bankroll. You will find that starting out with a large ROR at first is fairly safe as long as you plan to cut back if you start to blow it. A 15% ROR suddenly becomes under 6% if you plan to cut back later on (if necessary). Since there is only about a 1/3 chance that you will lose half of your bankroll in the first place, this may be something to consider.
The
ROR Odds row calculates your odds of going broke based on the ROR above it. If the ROR Odds box has a 15 in it, that means you have a 1-in-15 chance of losing your entire bankroll. It gives a little more meaning to the ROR figures.
Anyway, enjoy it. Let me know if you run into any problems or have any questions.
-Sonny-